
Always Discovering. Always Sharing.
Cortana Analytics Suite: End to end big data solution
Data on its own is useless. You have to be able to form analysis on it to be eventually take action. Cortana analytics can help you build your analytic solution, fast.
Today business want to reduce costs in their organization and get better insights of what's happening, provide better customer experiences based off of the data they pulling in and to organizations that will truly looking to transform business by creating new business models that the data analytics provide for them. We can see customers using data across a whole range of different scenarios today from sales and marketing to finance and risk, customer and channel to operations. Simplest examples are online fashion store, one of them notices that they're having a dip in customer satisfaction with their customers, and when they investigated they found that they were recommending pregnancy clothes to women that were not pregnant, so that wasn't going down too well. Hence they started to gather a lot of data to refine their recommendation algorithm, that bring data from their web sites together with that data out of their existing customer relationships systems bringing it together with other sentiment into the data and really sort of refine the data and manage it, provide much more personalized product recommendations for those customers. This really improve the satisfaction of customer shopping experience and improved the bottom line for the organization.
Another great example is predictive maintenance, one of the world's largest elevator company traditionally done that business was to send a regular maintenance to maintain those elevator, they would go out with a whole set of equipment, diagnostics materials to service the elevator. By just soldering the sensor to the elevator, elevators bring the data back in, and using that data and analytics on top of it, this company is able to start to do things like predicts when failures might occur, providing much more targeted maintenance schedules out to those elevators. Helping customers get a much better experience in terms of the uptime of those elevators and also allow them to provide much better maintenance scheduling. Helping them reduce costs and actually can even go further than that and provide better elevator up time because they now have that much more confidence on their elevators, that they can be serviced proactively and not only when they are down.
Data on its own is useless. You have to be able to form analysis on it to be eventually and ultimately take action that lets you take action to improve your business. You start at the bottom of following picture and work your way up and this is used to be the way that analytics happened.
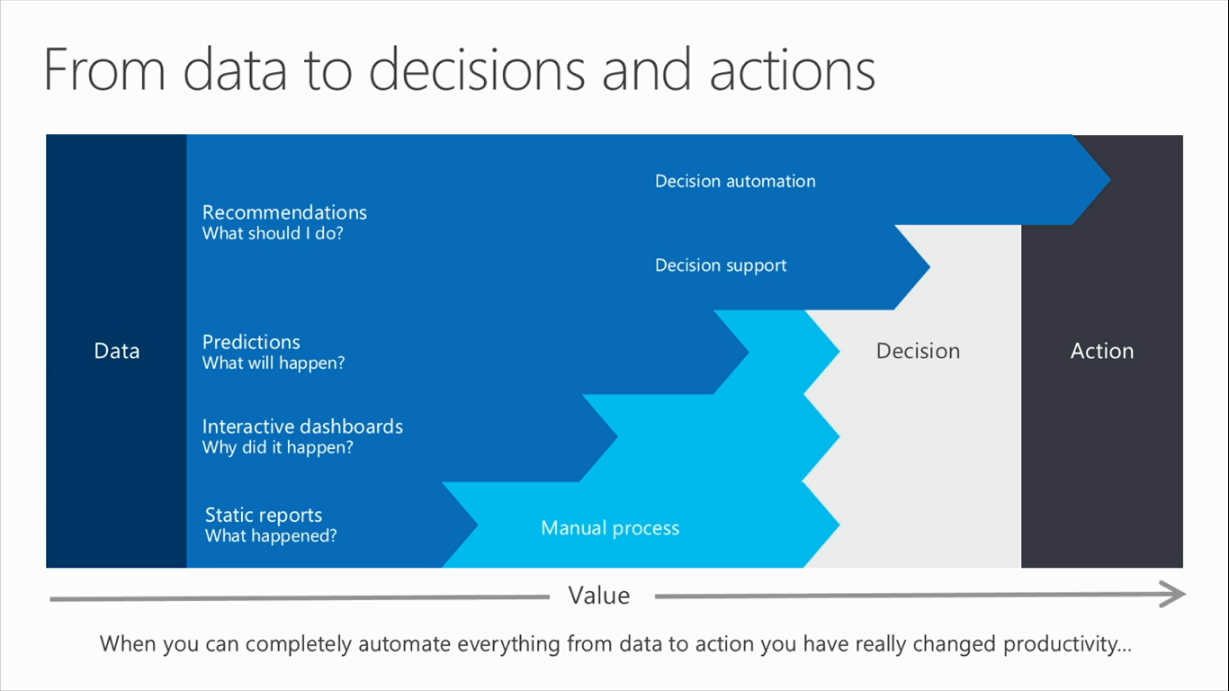
Say you gather a set of data, produced a static report, grab a group of people, bring them together in a room, look at the data, to decide to take some action there, then go out of the room take the action, might be one off action in which case they done or it might be an action that they need to come back and see the results of and if they need to do that then they would wait some period of time. Then gather the next set of data come back in the room then review the data. Very long process to find those insights and take the action. As people became more and more savvy about the data that they wanted to operate with, they started to gather more of it and provide really sort of interactive ways to operate and explore that data in real-time, interactive slicing and dicing and dashboards and providing much more immersive experiences to find those insights on that data.
Things really start to change if you can start to predict what will happen in the future. Today is grateful looking in the rear-view mirror with you can really start to predict what will happen in the future it really starts to change the types of business outcomes that you can expect. You can get ahead of looking at things that have failed in the past, to predicting when things will go wrong in the future, taking immediate action to be able to take advantage of those things. If you can go the full way and actually all the way to being able to recommend and automate that action then you now completely automated everything. They let you go from data to action directly and that really changes the sort of productivity that an organization can expect. Personalized product recommendations delivered out of websites in real time are great examples of that. To been able to really automate that full process to go from day-to-day decision and action, really is the opportunity that we want to be able to enable for our customers. What does it take to build end to end solution, let's take a look at the services that comprise Cortana Analytics Suite which can help us build solutions fast and scalable manner.
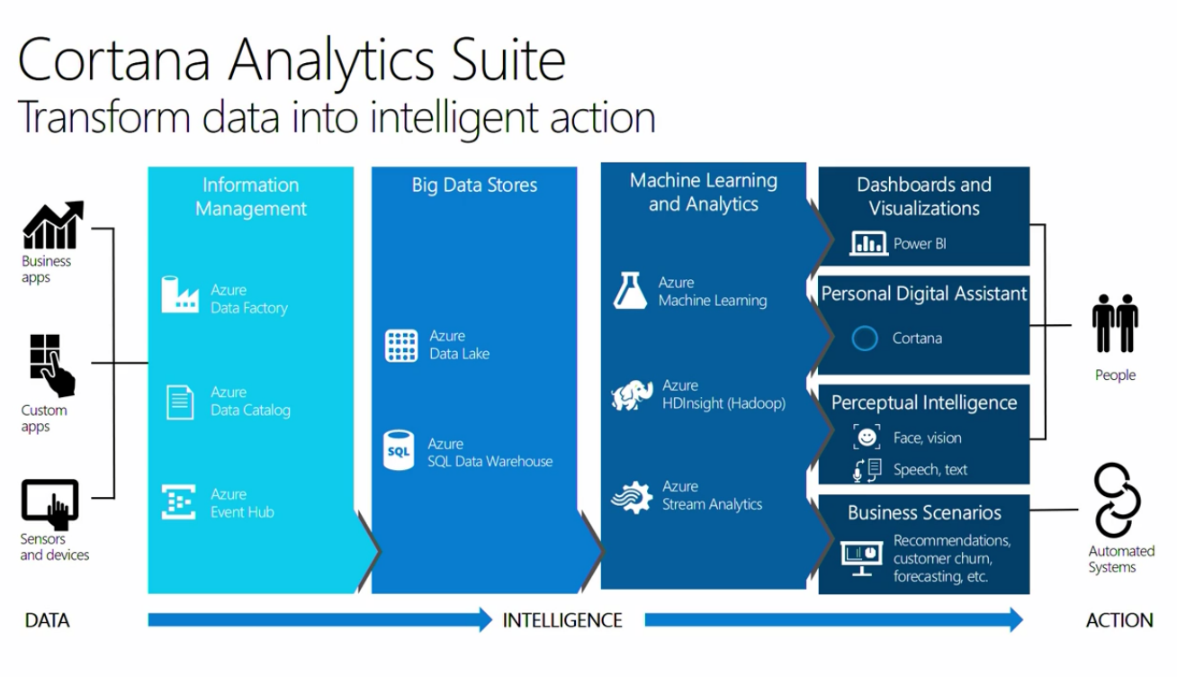
Cortana analytic suite is an intelligent cloud platform, a fully managed services that let you transform data into intelligent action. So first we should be able to connect to a whole range of different data sources, existing business applications that you've written yourselves and then increasing number of sensors and devices which generates massive amounts of data along with data out of existing businesses and business systems. You need a rich set of information management capabilities to manage this data, services such as the Azure Data Catalog, which provides the ability to index all the different data sources and discover the different data sources that exist in your organization, so that you can quickly find data. Azure Event Hub allows you to ingest massively scalable amounts of event data into azure and Azure Data Factory offers a way to orchestrate and manage all the data movement and information management tasks that would really form part of one of these complex systems. This is large amount of data and storing it on-prem is going to be costly, this is where the power of the cloud really shines for me. the cloud to all intents and purposes offers to customers an infinite storage and compute and with that what can you do, well if you can store huge amounts of data in the cloud really cheaply and perform really scalable analytic, that opens up so many possibilities. But just storing large amounts of data efficiently for analytics is a real challenging, azure data lake and azure data warehouse can help in storing data efficiently. Azure Data Lake is actually a service that lets you store petabytes of data in a massively scalable HDFS compatible files for analytics and this is an innovation that actually came from inside of Microsoft, they've used to power a number of their own services such as bing, Xbox and some of the telemetry behind Office and Windows etc and they're bringing a set of these really powerful high scale analytics storage and analytic systems to customers. Azure data lake is massively scalable file system where you are able to do very high performance IO over huge amounts of data. The Azure SQL Data Warehouse is the industry's first truly elastic scalable data warehouse. This is a traditional relational data warehouse where you can use sql queries over your data. The beauty of this service is that it lets you spin up the query compute power that you need and spin it down as and when you need it. Data stays in exactly the same place, you can speed up computer to run queries over that data as you see fit. So you can imagine if you're running reporting and analytics over a set of data and you're running it on a weekly or monthly basis and data sits in-out warehouse then you spin up the computer you need it, only when you need it, and in the meantime if you don't need it you can pause it and and don't pay for it, don't pay for that compute.
On top of that storage have a rich set of analytics capabilities. Azure Machine Learning is a service which really helps you bring the power of predictive analytics to your data. It has very rich set of best-in-class algorithms both some that have come from inside the Microsoft but also fully embracing the open source community and in particular languages such as R and python to let you write and your analytics. HDInsight is our distribution of Hadoop, running as a service in azure, so you can walkup to azure, spin up a HDInsight clusters on it, run it for as long as you like and then shut it down. And again this is separate from the data, this is very powerful, best example would be a customers who were storing large amounts of data, gathered over years and then as they started to think about the analytics, they would start to spin up Hadoop clusters, run 100 node clusters for a week or two and then shut them down, the data remains until they want to do that next time. Azure Stream Analytics that lets you write streaming jobs in a very easy way with the simple language.
When it comes to consuming this data, there was number of different ways that data might be consumed. So there is dashboards and visualizations through as ervice called Microsoft PowerBI which gives very rich, very interactive, very powerful set of visualizations experience for both reporting, interacting and investigating your data. So Cortana Suite has really powerful and rich set of capabilities to effectively create intelligent cloud for analytics. Lets switch now to a demonstration and show these components. I'm going to talk about an example here of vehicle and driving behavior patterns. The interesting thing about it is that by 2020, 75% of cars built will be internet-connected.
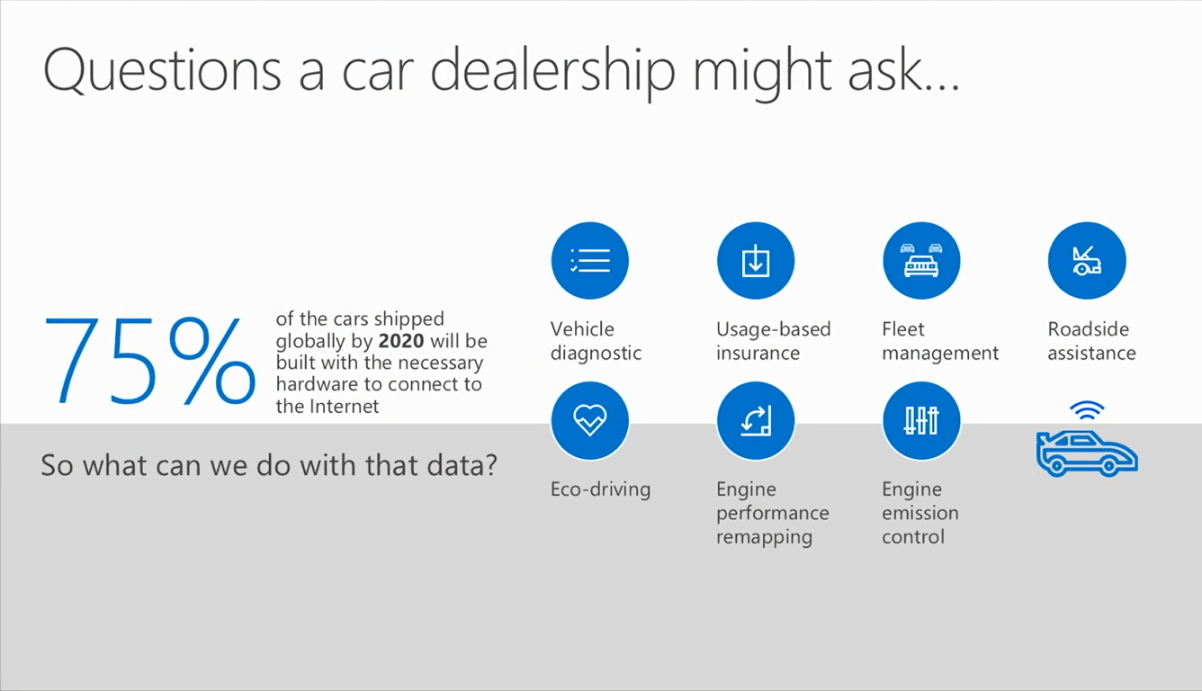
That will make them one of the most powerful devices out there. Cars can generate an amazing amount of telemetry, truly interesting to think about what of some of the things that we might do with that data and this can range anywhere from vehicle diagnostics to help dealers and with maintenance schedules, usage based insurance which is already happening today where insurance companies are putting devices on cars to monitor the driving behavior and providing customized insurance policies based off of that driving behavior. You can also imagine much tighter control and improvement of the car itself through engine performance mapping, engine emission control and much tight control over the vehicle itself. So if I were a car dealership and I had a fleet of cars, so what's some of the things that I might want to do. So below is PowerBI dashboard.
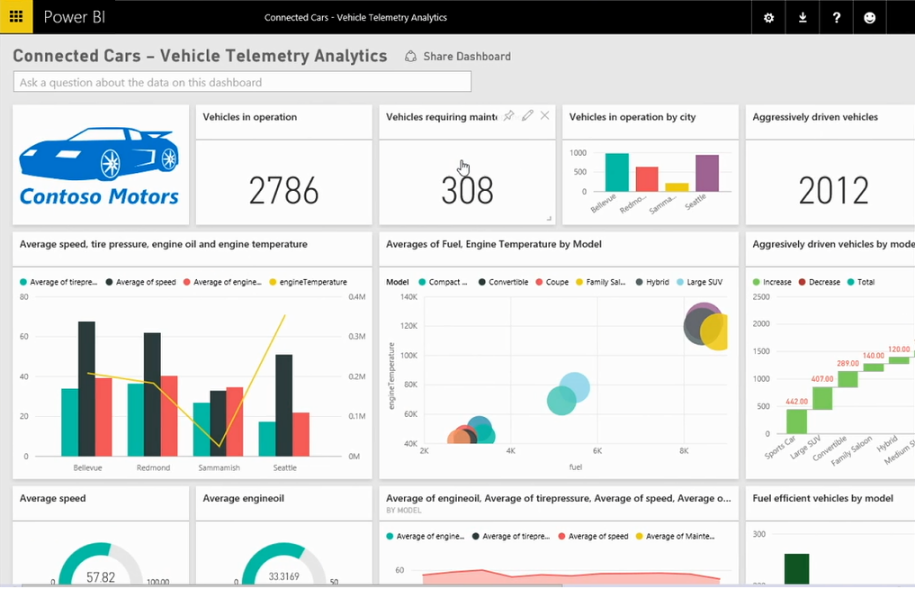
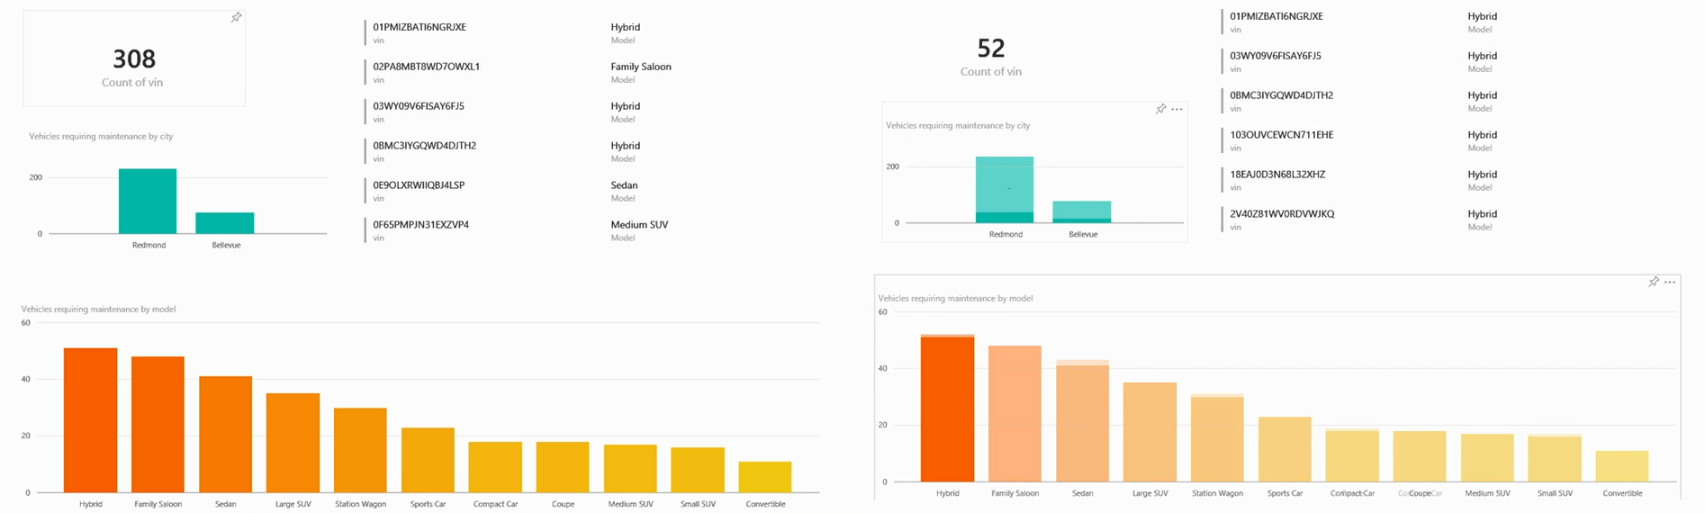
We have used power BI and built a dashboard that shows two types of data. Real-time data streaming and aggregate data. Let's drill into a couple of these areas to see what we have and then go into the details of how this was built. Vehicles requiring maintenance, I've been pulling telemetry off the car checking things like engine oil pressure etc etc, are indicators of things that might suggest that car might require maintenance and I can see here that looks like a hybrid cars needed more maintenance and I can see that Redmond is the place that I should be targeting. So I can use this data to say for examples end out a personalized campaign into the Redmond district to a set of customers to bring in set of a hybrid cars and family cars for servicing, have dealer perhaps prepared with all of the right parts that they need for maintenance.
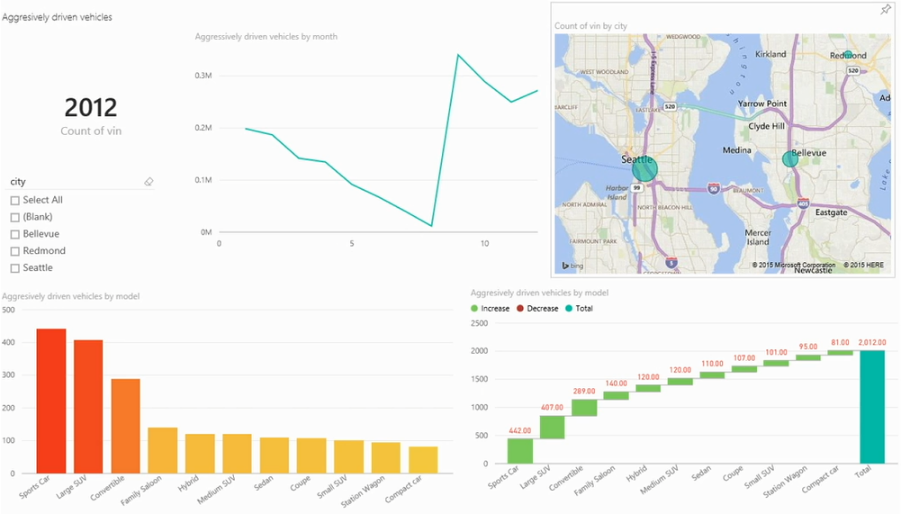
The aggregate side here I'm looking at aggressively driven vehicles, unsurprisingly sports cars look to be the cause of being most aggressive driven and compact cars at lowest on that. Also I have a map here showing that the majority of aggressive driving seems to be happening over in Seattle and Bellevue.
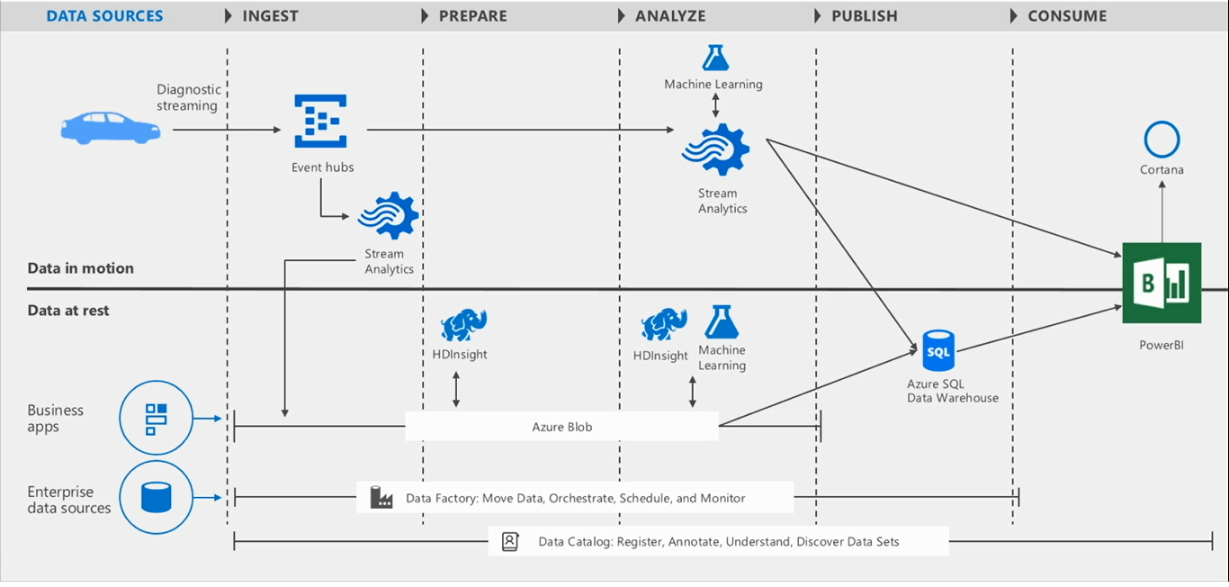
So what does it take to build this kind of a solution. When building solution like this, the dashboard I showed you had two parts to it, data in motion part, so real time and then data at rest, aggregate part, that capture data at the top and the bottom parts of this diagram. And the left or right flow here is data comes in, the typical processes is, the data needs to be ingested and stored, some form of preparation occurs and analysis over the data, that is published at some location and then the dashboard or some other form of data consumption. For the live data we use the data coming off of the car, goes to azure event hub, this is a massively scalable event ingest system that let you stream in millions of events per second, very scalable and we use stream analytics to persist data to storage, we also stream analytics to do some analysis over that data in terms of batch of aggregates and also applying ML algorithms over it.
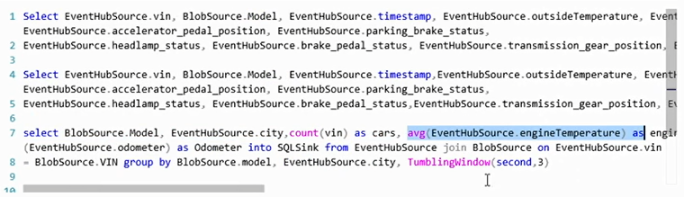
Let's see what that looks like in azure ML. We are using the Stream analytics and here I'm pulling data from an event data stream together with some reference data from blob storage and what I want to do is bring that data, join it together, present and aggregate on PowerBI dashboard that I showed you earlier. So let's look at the query that it takes to actually accomplish that. This is really where the power of azure stream analytics really comes to the front, so here on below screenshot I've got all of the queries that I'm running on all of the code that's written to power the analytics for that dashboard. You can see here I'm writing with a normal sequel language that many people are very familiar with. See highlighted piece of the code, it says selecting from an Input Stream a set of values and I'm doing things like averaging the engine temperature and outputting that. I'm doing this on a on a window of every three seconds. Every three seconds a window of time will roll over so from the top of every minute from zero to three seconds one window, 3 to 6, 6 to 9 and so on. In these time slot I'm continually computing averages and that's actually quite a sophisticated piece of analytics to do and if you had to write that in custom code it's often hundreds of thousands of lines of code and it's hard to get right.
Azure provide very powerful primitives as part of the stream analytics language but let you do very powerful analytics very easily. Isn't this very cool. I know it is. So with this very simple query I can produce a set of analytics showing average temperature, engine temperature, oil pressure etc and show that into the dashboard. And how do I put into the dashboard, well I output the data to sql database and then from there i read in PowerBI Dashboard. So you might be asking, that this is great but what about running a predictive maintenance code over it. Well to answer that azure provides service called machine learning. Again another fully managed service that we can use very easily, you can build machine learning experiments really easily, share them with colleagues, work on them together and build out very powerful machine learning experiments. You can use the full power of R and python along with many out of the box algorithm both from Microsoft and community.
Classic problem in analytics is often that different people will work on different parts of the problems faced with different tools and when it comes to handing off the algorithms across organizational people boundaries, friction arises, it might be "hey i cant read R, I need to rewrite this in java or .net to expose as a web service" and it takes time, often this is the place where algorithm get screwed and end product don't produce accurate result. With azure machine learning you can take any experiment and can publish it as a as a Web service with few clicks. Then its just a matter of going to the web service and you have machine learning algorithm ready to be consumes in any damn technology, which is scalable, secure and you don't need to worry about the operationalization of that endpoint. you can very quickly go from your experiment to fully operationalize web service which you can then call, in real-time on a dashboard and that does really transform the productivity. This literally cut down the solutions building time to hours and days from weeks and at times months.
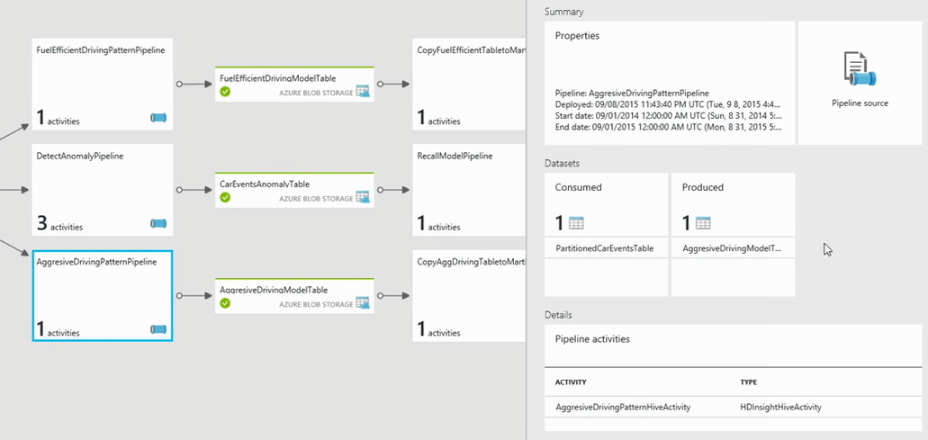
Now lets look at the aggregates data path. Here what I'm doing is bringing that data together which is coming in through the stream, with a set of data from CRM dynamics or from the business apps and I'm persisting it into a blob storage and using HDInsight clusters to run over that data. I'm using machine learning as part of the process and I'm using azure data lake to bring the data together, aggregate it, transform it, prepare it, analyze it, take the result set and put it into a data warehouse. Building these data pipelines is quite complex job, writing complex integration code to make all bits and pieces work is not easy, and not to forget scalability issues. Azure make it really easy to build and maintain such complex data pipeline. Azure data factory which basically provides again another fully managed service to let you focus on the analytics and it take care of running and orchestrating the work for you. Let's take a look at that service. Below is data factory for the connected car dashboards and here we see is the real live pipelines that are running behind the system. Here you can see how data flows through system, that's all it is. Saying is that the truth is always in the code, but here we can visual see what code is actually doing. For monitoring perspective everything is running great and it is immediately visible.
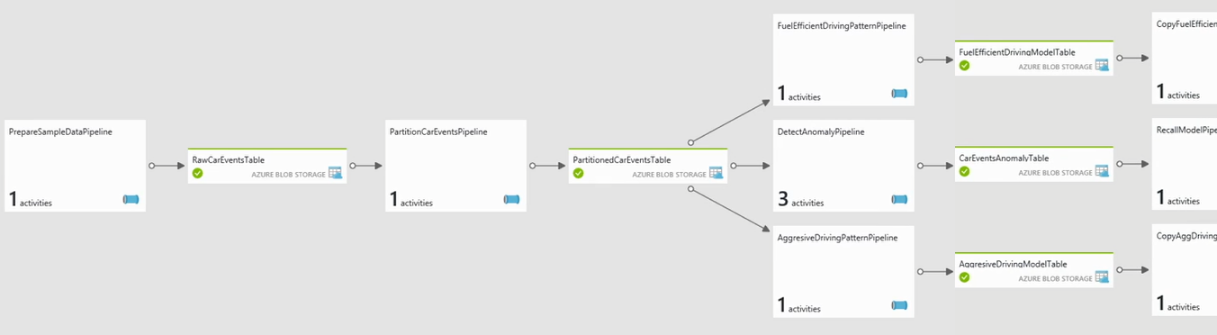
Lets drill into one part of this for the aggressive driving pipeline pattern and I can see here what I'm doing is I'm running a set of activities in a sequence and this is a HDInsight activities.
If I dig in more, we can see here this is the definition of what a a aggressive car driver looks like.
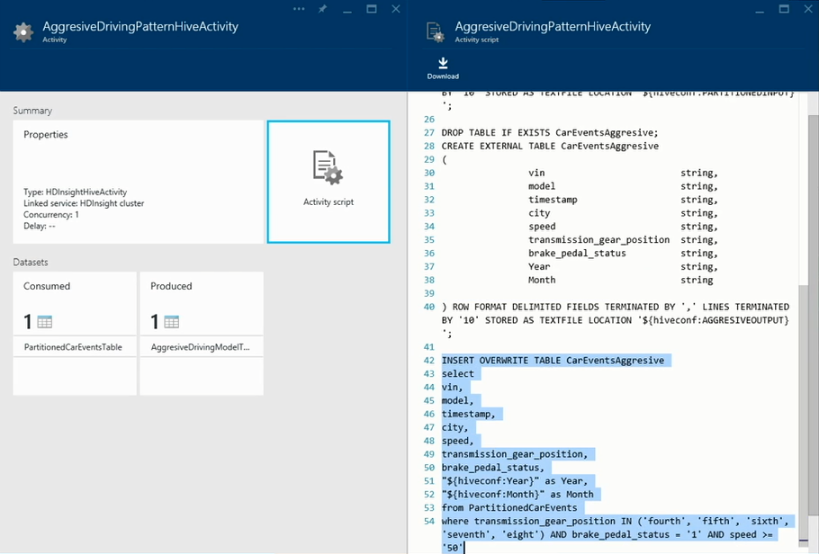
It says "hey it's anybody who's in fourth fifth sixth seventh or eighth gear, who hits the brake pedal hard, or who's speed was over 50 miles". So this is the analytics that we're running as part of the pipeline and the beauty of this is that I can from a single diagram navigate through my entire analytics processing pipeline. I can monitor and manage what's actually happening and if something fails, I can see that here really easily. Sometimes you just wonder if you want to rerun part of your data pipeline again, then you have to write custom code. Here it is literally a right-click rerun to run a parts of your data pipeline again. So I see here a live view of my full analytics pipeline. This is the overall system architecture that we have here for the dashboard. Really what I wanted to leave you with is that Cortana analytics suite is bringing together a very powerful set of analytics capabilities to really improve the productivity of building analytics apps in the cloud, to tie those in with different data sources to really reduce the cost of analytics solution, and time to build it, giving ability to experiment over the data quickly, finding sights on that data and then put those insights into action in a fully automated way to really close the loop in time it takes to go from data to intelligent action.